LoC Data Package Tutorial: Austro-Hungarian maps set#
This notebook will demonstrate basic usage of using the Pyton for interacting with data packages from the Library of Congress via the Austro-Hungarian map set which is derived from the Library’s Austria-Hungary Topographic Set Maps. We will:
Prerequisites#
In order to run this notebook, please follow the instructions listed in this directory’s README.
Output data package summary#
First, we will select the data package and output a summary of it’s contents
import io

import pandas as pd                     # for reading, manipulating, and displaying data
import requests

from helpers import get_file_stats

DATA_URL = 'https://data.labs.loc.gov/austro-hungarian-maps/' # Base URL of this data package

# Download the file manifest
file_manifest_url = f'{DATA_URL}manifest.json'
response = requests.get(file_manifest_url, timeout=60)
response_json = response.json()
files = [dict(zip(response_json["cols"], row)) for row in response_json["rows"]] # zip columns and rows

# Convert to Pandas DataFrame and show stats table
stats = get_file_stats(files)
pd.DataFrame(stats)
| FileType | Count | Size | |
|---|---|---|---|
| 0 | .tif | 9,881 | 1,142.47GB |
Read the metadata in a data package#
First, let’s load the data package’s metadata.csv file:
metadata_url = f'{DATA_URL}metadata.csv'
response = requests.get(metadata_url, timeout=60)
metadata_string = response.text

# Read contents as a csv file
df = pd.read_csv(io.StringIO(metadata_string), dtype=str, keep_default_na=False)
print(f'Loaded metadata file with {df.shape[0]:,} entries.')
Loaded metadata file with 9,885 entries.
Next let’s print the available properties
print(', '.join(df.columns.to_list()))
filepath, filename, parent_dir, file_format, object_type, tile_id, edition
Download and visualize GeoTIFF#
Next we will download a GeoTIFF file and visualize it.
First, let’s filter to only the GeoTIFF files and take the first one
geotiffs = df[df.file_format == 'GeoTIFF']
print(f'Found {geotiffs.shape[0]:,} GeoTIFF files.')
item = geotiffs.iloc[0]
Found 4,877 GeoTIFF files.
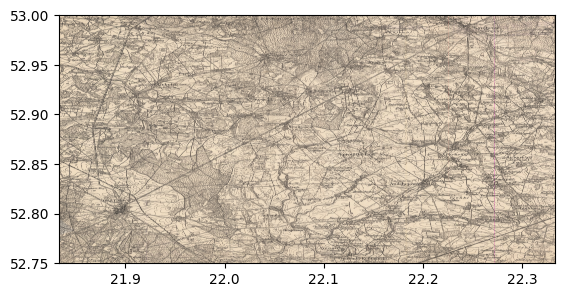
Next download the GeoTIFF file, display it, and visualize a specific band
from rasterio.io import MemoryFile
from rasterio.plot import show
filename = f"data/{item['parent_dir']}/{item['filename']}"
obj_url = f"{DATA_URL}{filename}"
response = requests.get(obj_url, timeout=60)
filestream = io.BytesIO(response.content)
with MemoryFile(filestream) as memfile:
with memfile.open() as dataset:
print(f"Opened GeoTIFF file with {dataset.count} bands and dimensions: {dataset.width:,} x {dataset.height:,}")
show(dataset)
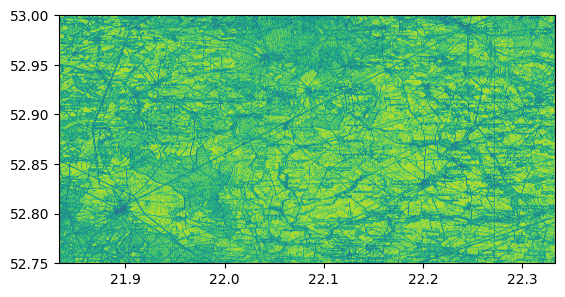
visualize_band = 2
show(dataset.read(visualize_band), transform=dataset.transform, cmap='viridis')
Opened GeoTIFF file with 3 bands and dimensions: 8,767 x 4,384